Soon after the beginning of the Sack Attack competition season, Mr. James Pearman posted this thread which ended up showing the 2-wire motors’ “strange” logarithmic Motor Control Value-to-Motor Speed curve:
https://vexforum.com/attachment.php?attachmentid=6175&d=1337975715
This was the first time I had seen this, although our team had always somewhat noticed a difficulty in controlling our robots (specifically geared-up drives) at slower speeds. If you look at the graph, you can see that in order to get the motors to run at half-speed (63, or about 55 RPM), you would need to push the joystick less than a fifth of the way (24/127). You can also notice that after a Motor Control Value of about 88, the speed of the motor does not change hardly at all. This seemed very inefficient to me, and makes driving more difficult than it has to be. That is what originally gave me the idea to remap the motor control values in order to gain a near-linear graph.
For our first tournament in June, I simply took the graph, and utilized Mr. James’ test results to create an array of 128 values, remapping the (unsigned) joystick values inputted into it in order to get a linear motor speed control from 0 to 127. This proved useful, and did seem to help, although it was not perfect. One flaw was that the values used were based on 269 motors running without any load at all, while I was running 393 motors geared up and on a rather heavy competition robot. What I needed to do was create an array specifically tailored to our robot.
Because we really only needed this fine control on the drive, that was what I ended up doing testing on. I got a few foam tiles and created a square to run the robot on for testing, and ran a program that gave a Motor Control Value to all the motors on one side of the drive for about 5 seconds (with one additional second at the beginning to allow the motors to accelerate) before taking count of the value of the IME on that half of the drive, and calculating a speed in RPM for that Motor Control Value. It would then step to the next power value and repeat the process, for every value from 1 to 127. I preformed this test both from 1 to 127 and 127 to 1, on the left and right sides, monitoring the battery voltage along the way, to ensure that it did not drop very much (once it dropped to a certain voltage, I would pause the test and replace the battery).
I then took all the data I had collected and placed it into an Excel spreadsheet. Here is a graph I created with the data from 24C’s robot that we brought to the World Championship:
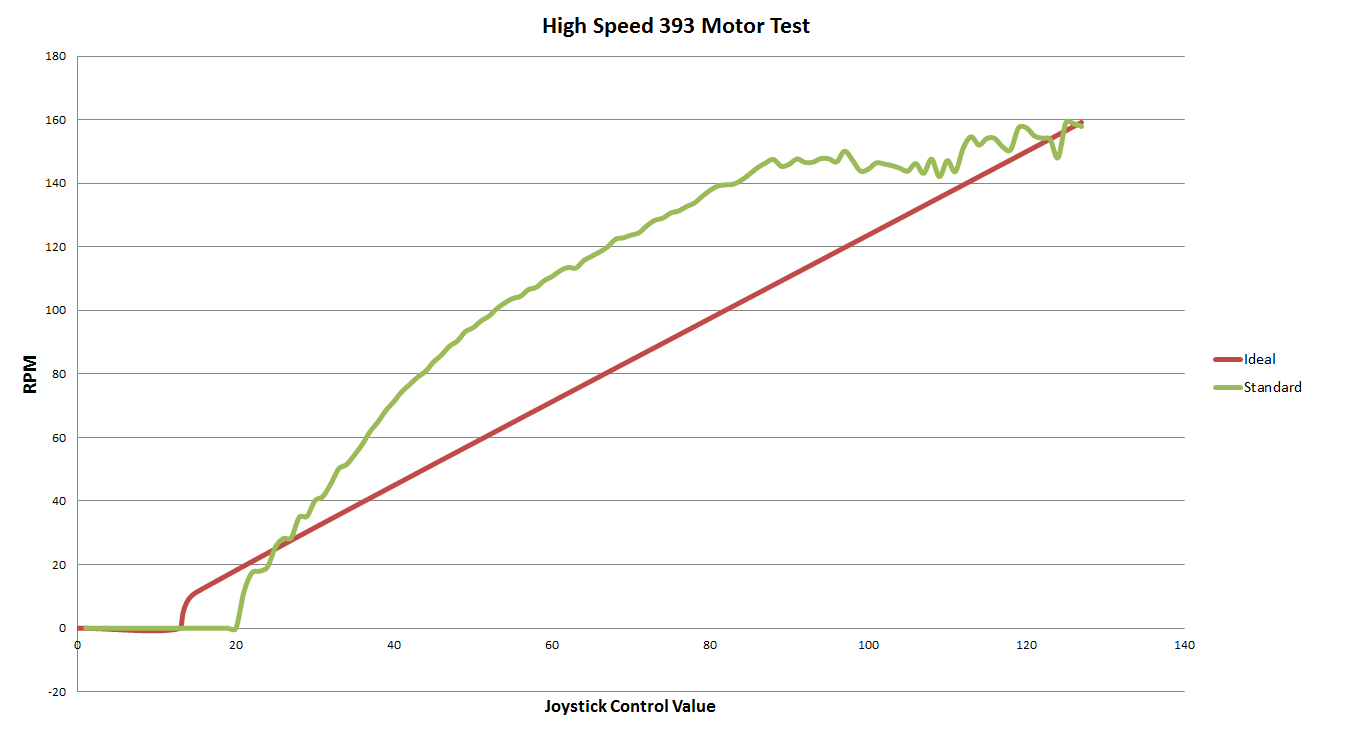
Using this data, I was able to create an array so that this curve would be as close to the red “Ideal” line on the graph as possible. I did this by first deciding that I did not want to let the drive begin moving until the joysticks reached above ±10 (to act as a threshold for the joystick springs). Then, I knew that the value for 11 would be the first Motor Control Value that consistently kept the robot moving. That value happened to be 21 for our robot, and the RPM at that power was ~15. I also knew that the value for 127 would be the fastest, which of course was 127, and the RPM at that power was just under 160 (the motors were internally geared for speed). Knowing those two points on the graph, I could then calculate every single other point for the ideal graph. I could get the ideal difference in RPM between each array value by simply taking (160-15)/(127-10), which equals 145/117, or ~1.239.
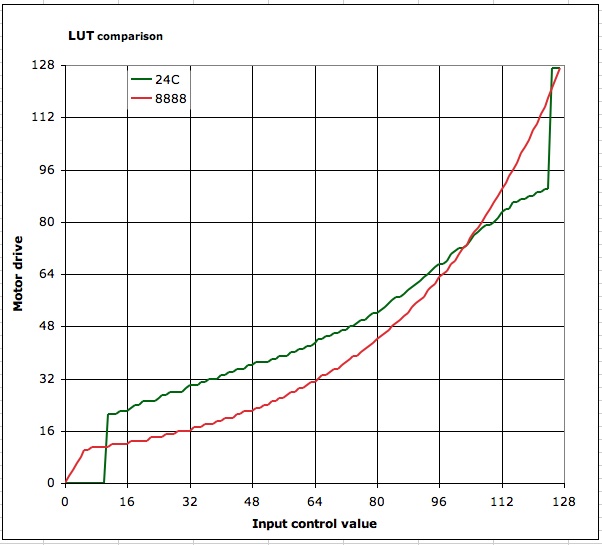
From that number, I could conclude that the value for 12 should be whatever Motor Control Value gave a speed closest to (15+1.239) = 16.239 RPM. I then continued doing that for 13, 14, etc., until I reached 127. I then had a completed array. Here is the array that I ended up creating for 24C:
// compensates for non-linearity of control value vs speed curve
const unsigned int TrueSpeed[128] =
{
  0,  0,  0,  0,  0,  0,  0,  0,  0,  0,
  0, 21, 21, 21, 22, 22, 22, 23, 24, 24,
 25, 25, 25, 25, 26, 27, 27, 28, 28, 28,
 28, 29, 30, 30, 30, 31, 31, 32, 32, 32,
 33, 33, 34, 34, 35, 35, 35, 36, 36, 37,
 37, 37, 37, 38, 38, 39, 39, 39, 40, 40,
 41, 41, 42, 42, 43, 44, 44, 45, 45, 46,
 46, 47, 47, 48, 48, 49, 50, 50, 51, 52,
 52, 53, 54, 55, 56, 57, 57, 58, 59, 60,
 61, 62, 63, 64, 65, 66, 67, 67, 68, 70,
 71, 72, 72, 73, 74, 76, 77, 78, 79, 79,
 80, 81, 83, 84, 84, 86, 86, 87, 87, 88,
 88, 89, 89, 90, 90,127,127,127
};
Before I go into the strange jump from 90 to 127 at the end, I want you to take another look at the graph of the motor speeds:
Notice how from a Motor Control Value of about 85 to 127, instead of consistently increasing like it had been, the speed jumps rather randomly up and down, and doesn’t really increase by very much as a whole. This was the main reason to just about get rid of this portion. Here is a comparison with the results when the same exact speed test was done using the array above:
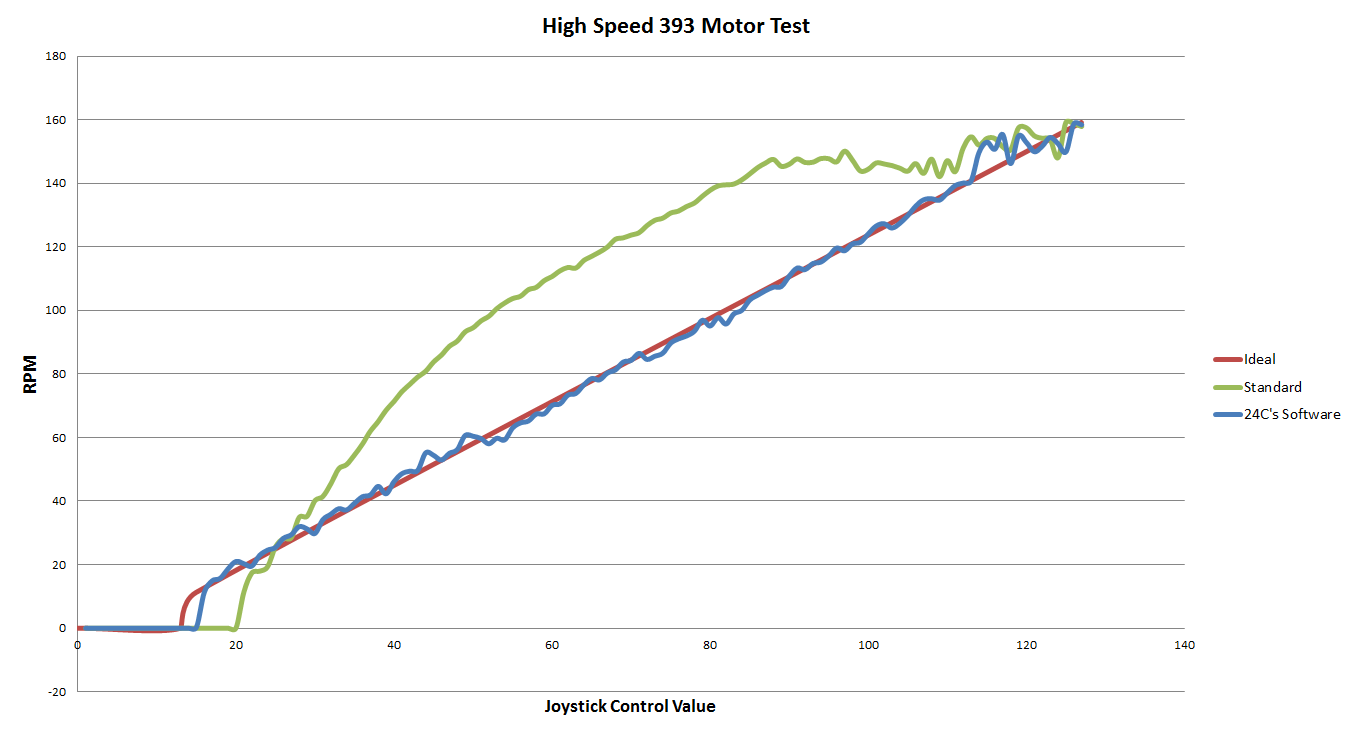
As you can see, we were able to achieve near-perfect results, getting our array to map the values in order to create a very close to linear graph, right along the ideal line. We found this to be helpful in user control, allowing the driver to have great control of the robot’s drive at any speed.
If you have any more questions on how to do this, or have comments on it, please feel free to make a post below.
Thank you,
~Jordan