Hi everyone! VEX V5 robot code frameworks like PROS and VEXCode don’t give line numbers or file names after a crash; instead, they give an address number. On its own, this isn’t super helpful for human programmers, so I’ve been working on a Visual Studio Code extension called Symbolizer for VEX V5 which can turn this number into something useful by jumping directly to the location of the crash in your source code. It supports PROS, VEXCode, and more while requiring little to no setup.
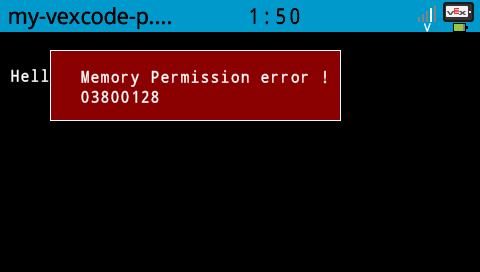
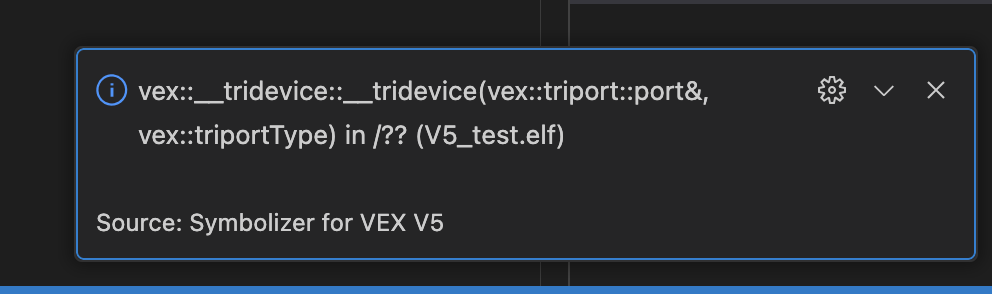
After a data abort exception or a similar crash, type the hexadecimal number displayed on the second line of the brain’s screen into the extension’s “Jump to Address” command. The editor will then reveal the location where your code crashed. (Click here for detailed instructions)
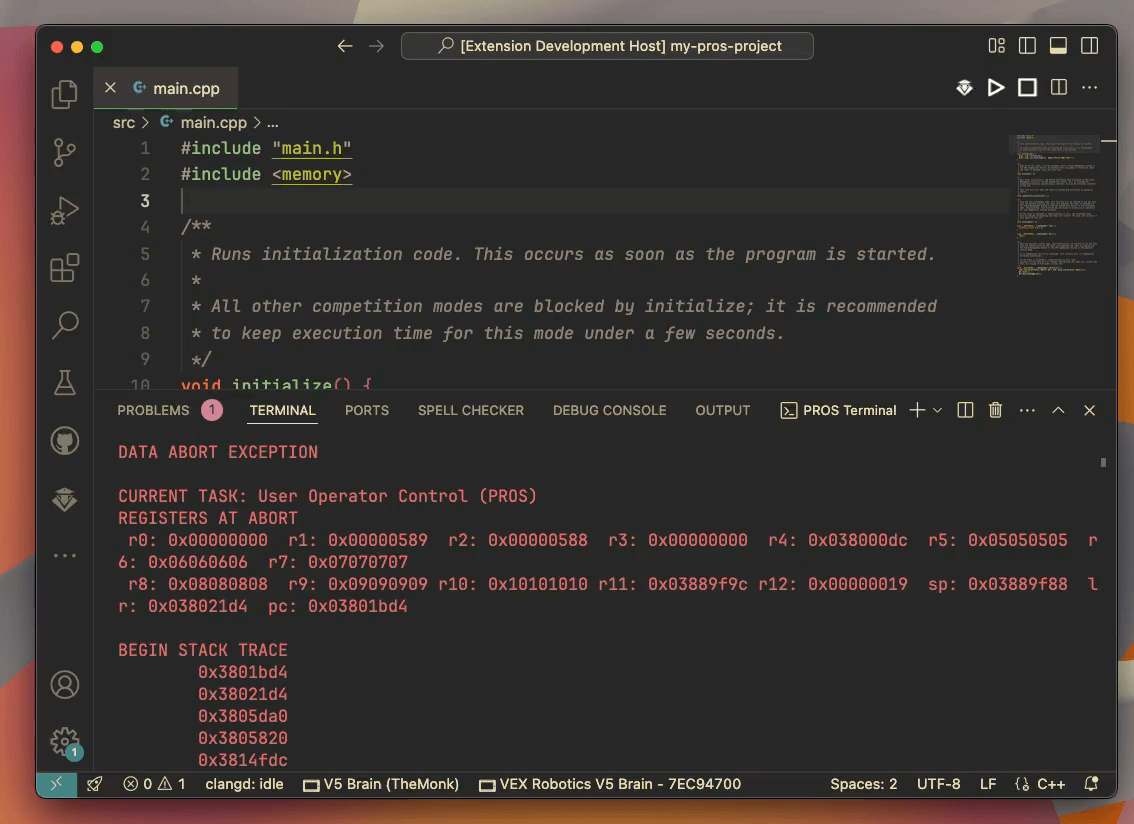
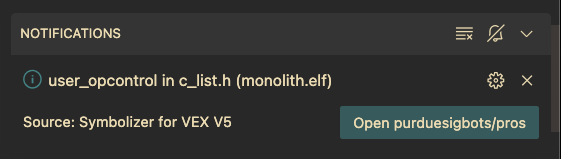
The extension can also help you step through lengthy PROS stack traces by making each address clickable in the brain terminal. Just Ctrl/Command+Click on each line, and Symbolizer for VEX V5 will take you to the next piece of code that led to the crash. It makes debugging so much easier because it lets you see exactly “why” a crash happened instead of just “where!” (Click here for detailed instructions)
Also, since the PROS source code is published online, the extension will give you a link to the relevant GitHub page and line number if you try to jump to a line of code inside PROS itself!
If all this sounds useful to you, check out the extension on the VS Code marketplace:
https://marketplace.visualstudio.com/items?itemName=vexide.symbolizer-for-vex-v5
You can also swing by the GitHub repository if you’d like to read the source code:
https://github.com/vexide/symbolizer-for-vex-v5
Caveats
Although the extension works out of the box with PROS, there are a few caveats for VEXCode users:
- VEXCode doesn’t store the required debug metadata by default. However, the extension can enable it for you and will ask to do so the first time you jump to an address!
- VEXCode also doesn’t install the tools the extension uses to read the debug metadata. If the extension detects they’re not installed, it will prompt you to install the PROS VS Code extension or LLVM. (You don’t actually have to switch to PROS or anything, you just need it installed!)