In April, I posted my primitive spreadsheet of random users’ data, collected by manually typing it into the spreadsheet, in Post to like ratio. @Foster suggested
and gave me the Discourse API documentation to study. I had never bothered with APIs before and was moderately bewildered, but I put on my mental list of things to try some time.
Two months later, I ran into APIs again. I googled it, and after a week or two of playing with APIs, I figured I should try the VEX API. I wrote a short script attached to a Google Sheet to fetch
function putUserDataInSpreadsheet() {
  var sheet = SpreadsheetApp.getActiveSpreadsheet().getSheetByName('Sheet1')
  var periodOptions = ['daily', 'weekly', 'monthly', 'quarterly', 'yearly', 'all']
  var period = periodOptions[5]
  var orderOptions = ['likes_received', 'likes_given', 'topic_count', 'post_count', 'topics_entered', 'posts_read', 'days_visited']
  var order = orderOptions[6]
  var search = 'https://www.vexforum.com/directory_items.json?period='+period+'&order='+order+'&page='
  var pages = 100
  for (var page = 0; page < pages; page++) {
    var response = JSON.parse(UrlFetchApp.fetch(search+page))
    var userObjectList = response.directory_items
    Logger.log('Number of users: '+userObjectList.length+'. First user: '+userObjectList[0].user.username+'. Last user: '+userObjectList[userObjectList.length-1].user.username+'.')
    var tableOfUsers = userObjectList.map(function (userObj) {
      return [...[userObj.user.username, userObj.user.name], ...listify_(userObj, ['id', 'likes_given', 'likes_received', 'post_count', 'posts_read', 'topic_count', 'topics_entered', 'days_visited', 'time_read'])]
    })
    Logger.log(tableOfUsers.join('\n- '))

    sheet.getRange((page*50)+3, 1, tableOfUsers.length, tableOfUsers[0].length).setValues(tableOfUsers)
  }
  sheet.getRange('A1').setNote('Last updated: '+new Date().toUTCString('en-US', {dateStyle: 'short', timeStyle: 'medium', timeZoneStyle: 'short'})+'\nSorted by: '+order+'\nPeriod: '+period+'\nNumber of users pulled: '+(pages*50))
}

/**
 * Takes [[object]] and returns a list with elements of [[format]] replaced with their respective properties of [[object]].
 * @param {object} object Original.
 * @param {string[]} format Property names of [[object]] in order you want them.
 * @return {any[]} format
 */
function listify_(object, format) {
  return format.map(function (property) {
    return object[property]
  })
}
I installed JSON Viewer on the suggestion of @Noah10851B in a really old topic and when I visited that, I saw
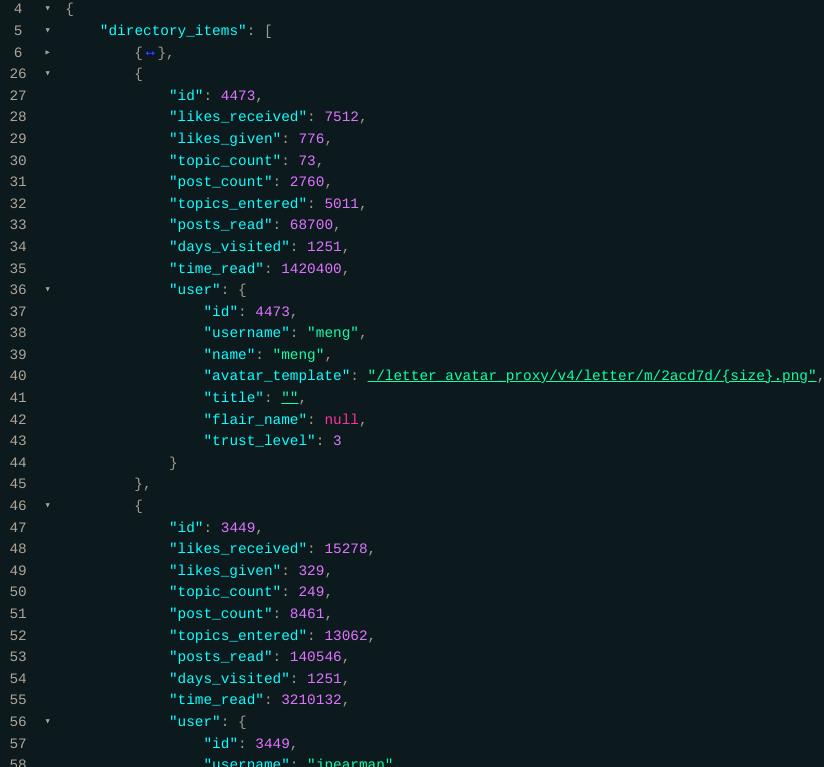
I ran the script to pull that page, reformat it into a 2D array, and paste it into the spreadsheet, over and over... a hundred times.
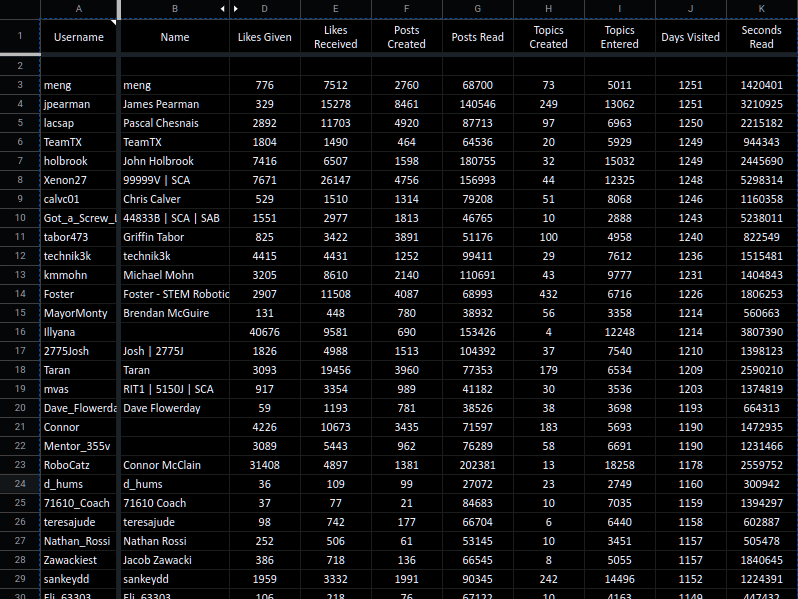
Then I added a bunch of columns to calculate ratios, averages, times, and anything else I could think of.
So now I present to you…
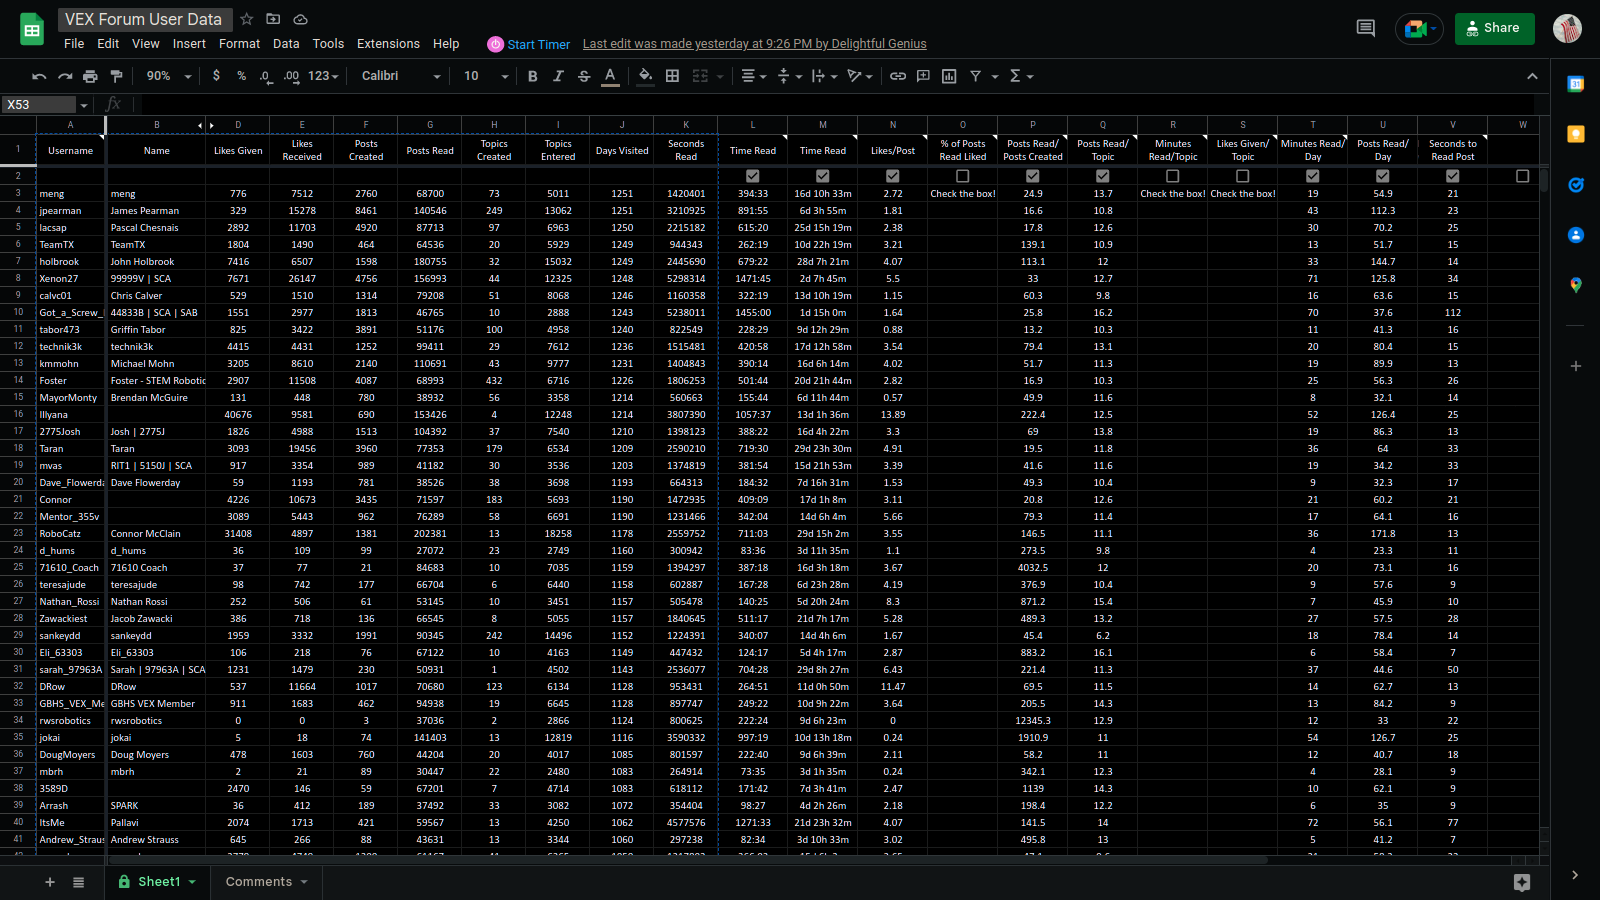
(Click it!)
I added a “Comments” tab you can see on the bottom, so if you have any comments, questions, or suggestions, add them there or PM me.
Have fun!