Preface
This post is heavily inspired by these two fantastic posts by @jpearman:
Motor torque-speed curves
Motor torque-speed curves - REV2
These threads sparked my curiosity into the complicated dynamics of DC motor performance way back in 2015, and I am very greatful to James for having written them. It is my hope that this thread can in some way continue on that legacy and maybe serve as some inspiration of its own.
Also I’d like to thank Kenneth (you may know him for this or this) for help with the design of the flywheel including sourcing of parts.
Introduction
You may be asking - Hey, doesn’t VEX already publish torque-speed graphs for the V5 motors?
Yes! However, there are some issues with the official graphs that I’d like to go over. Here they are:
V5 Smart Motor (11W)
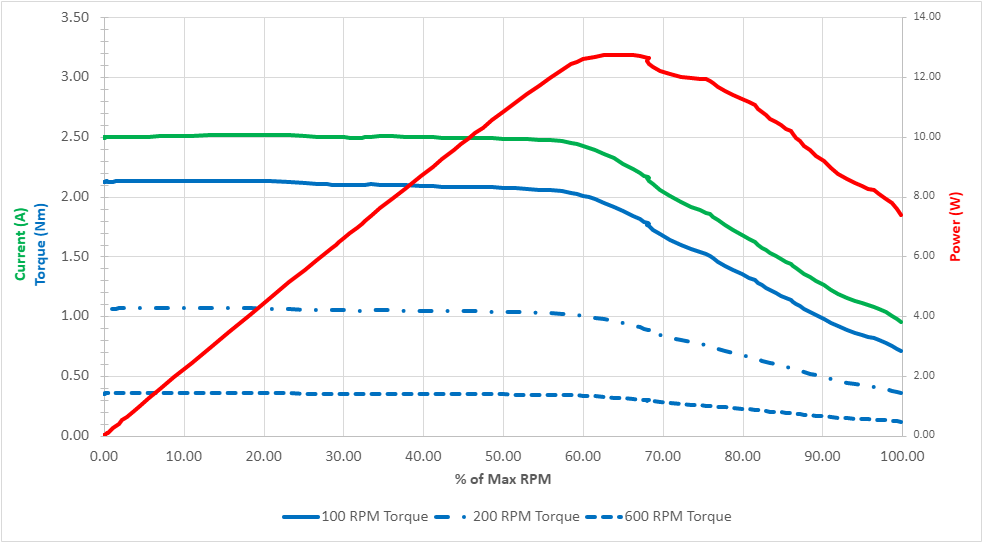
source
V5 Smart Motor (5.5W)
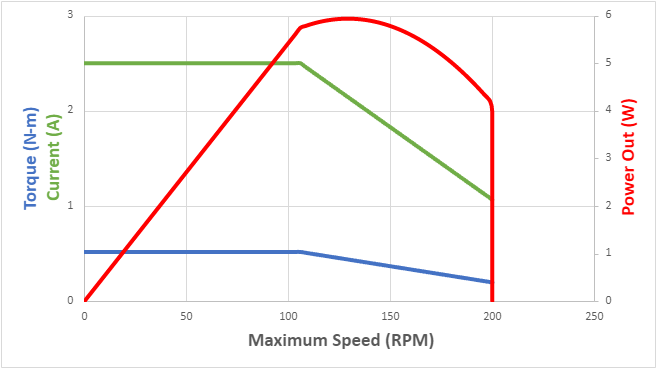
source
A few things to note:
- The 5.5W motor graph is almost certainly synthetic or idealized. Perfectly linear relationships like those depicted in the graph do not exist in these kinds of real-world problems.
- Both the 11W and the 5.5W graphs (especially the 5.5W) cut off early at the rated speed of each motor. There is significant headroom to the right of this artificial cutoff on the graph as the motors approach their free-spinning speed at maximum voltage.
- Measurements for Torque in the 11W graph appear to be directly proportional to current measurements, which could indicate they are calculated from current instead of directly measured. There is a strong relationship between these two values in the real world (generally, more current = more torque); however, it seems a little too perfect here. If this is the case, then the calculated power value would also be based on some assumptions that don’t play out in the real world.
Because of these reasons, I think there is some merit in independently measuring the motor’s performance, specifically via measuring the torque output of the motor at multiple speeds.
Methodology
Theory
Measuring torque at speeds other than stall is a challenging proposition. Using an electronic device such as a load cell to directly measure the torque is difficult because of the necessity to electrically connect a device which is connected to a rotating axle. Such tools do exist for this purpose; however they can be cost-prohibitive.
Another approach is to use the motor under test to spin up a large weighted flywheel for which the moment of inertia is well known, and measure the rate of acceleration of this wheel very precisely. Several options exist for this commercially; however it is also common to see R/C enthusiasts DIY their own. I chose to follow this latter approach.
How can we calculate torque and power by spinning a wheel? Math!
Here is Newton’s second law for rotation:
We see that Torque (\tau) is equal to the Moment of Inertia (I\,) times the Angular Acceleration (\alpha). Therefore, if we know the wheel’s moment of inertia and also what its rate of acceleration is at a given moment, we can calculate how much torque is being applied to the wheel.
To calculate power, we can use the equation:
We see that Power (P) is equal to the Torque being applied (\tau) times the Angular Velocity (\omega). Therefore, if we know the angular velocity and also the torque being applied to the wheel (from above), then we can calculate the instantaneous power output of the motor. We now have the math we need to generate our own graphs.
One thing to note here - our inputs to these equations are Angular Acceleration (\alpha) and Angular Velocity (\omega). As a result, accurate measurement of these values is critical to the accuracy of our results. Even very small amounts of jitter in our angular velocity measurements will cause larger errors in our angular acceleration measurements. Unfortunately there are some issues with the velocity measurements built into the V5 motor (se this excellent writeup by @Sylvie). Therefore, as you will see in the section below, I decided not to use the V5 motor’s internal encoder for velocity measurements, opting instead for an external high resolution encoder connected to an external microcontroller for maximum accuracy and minimal jitter.
Design
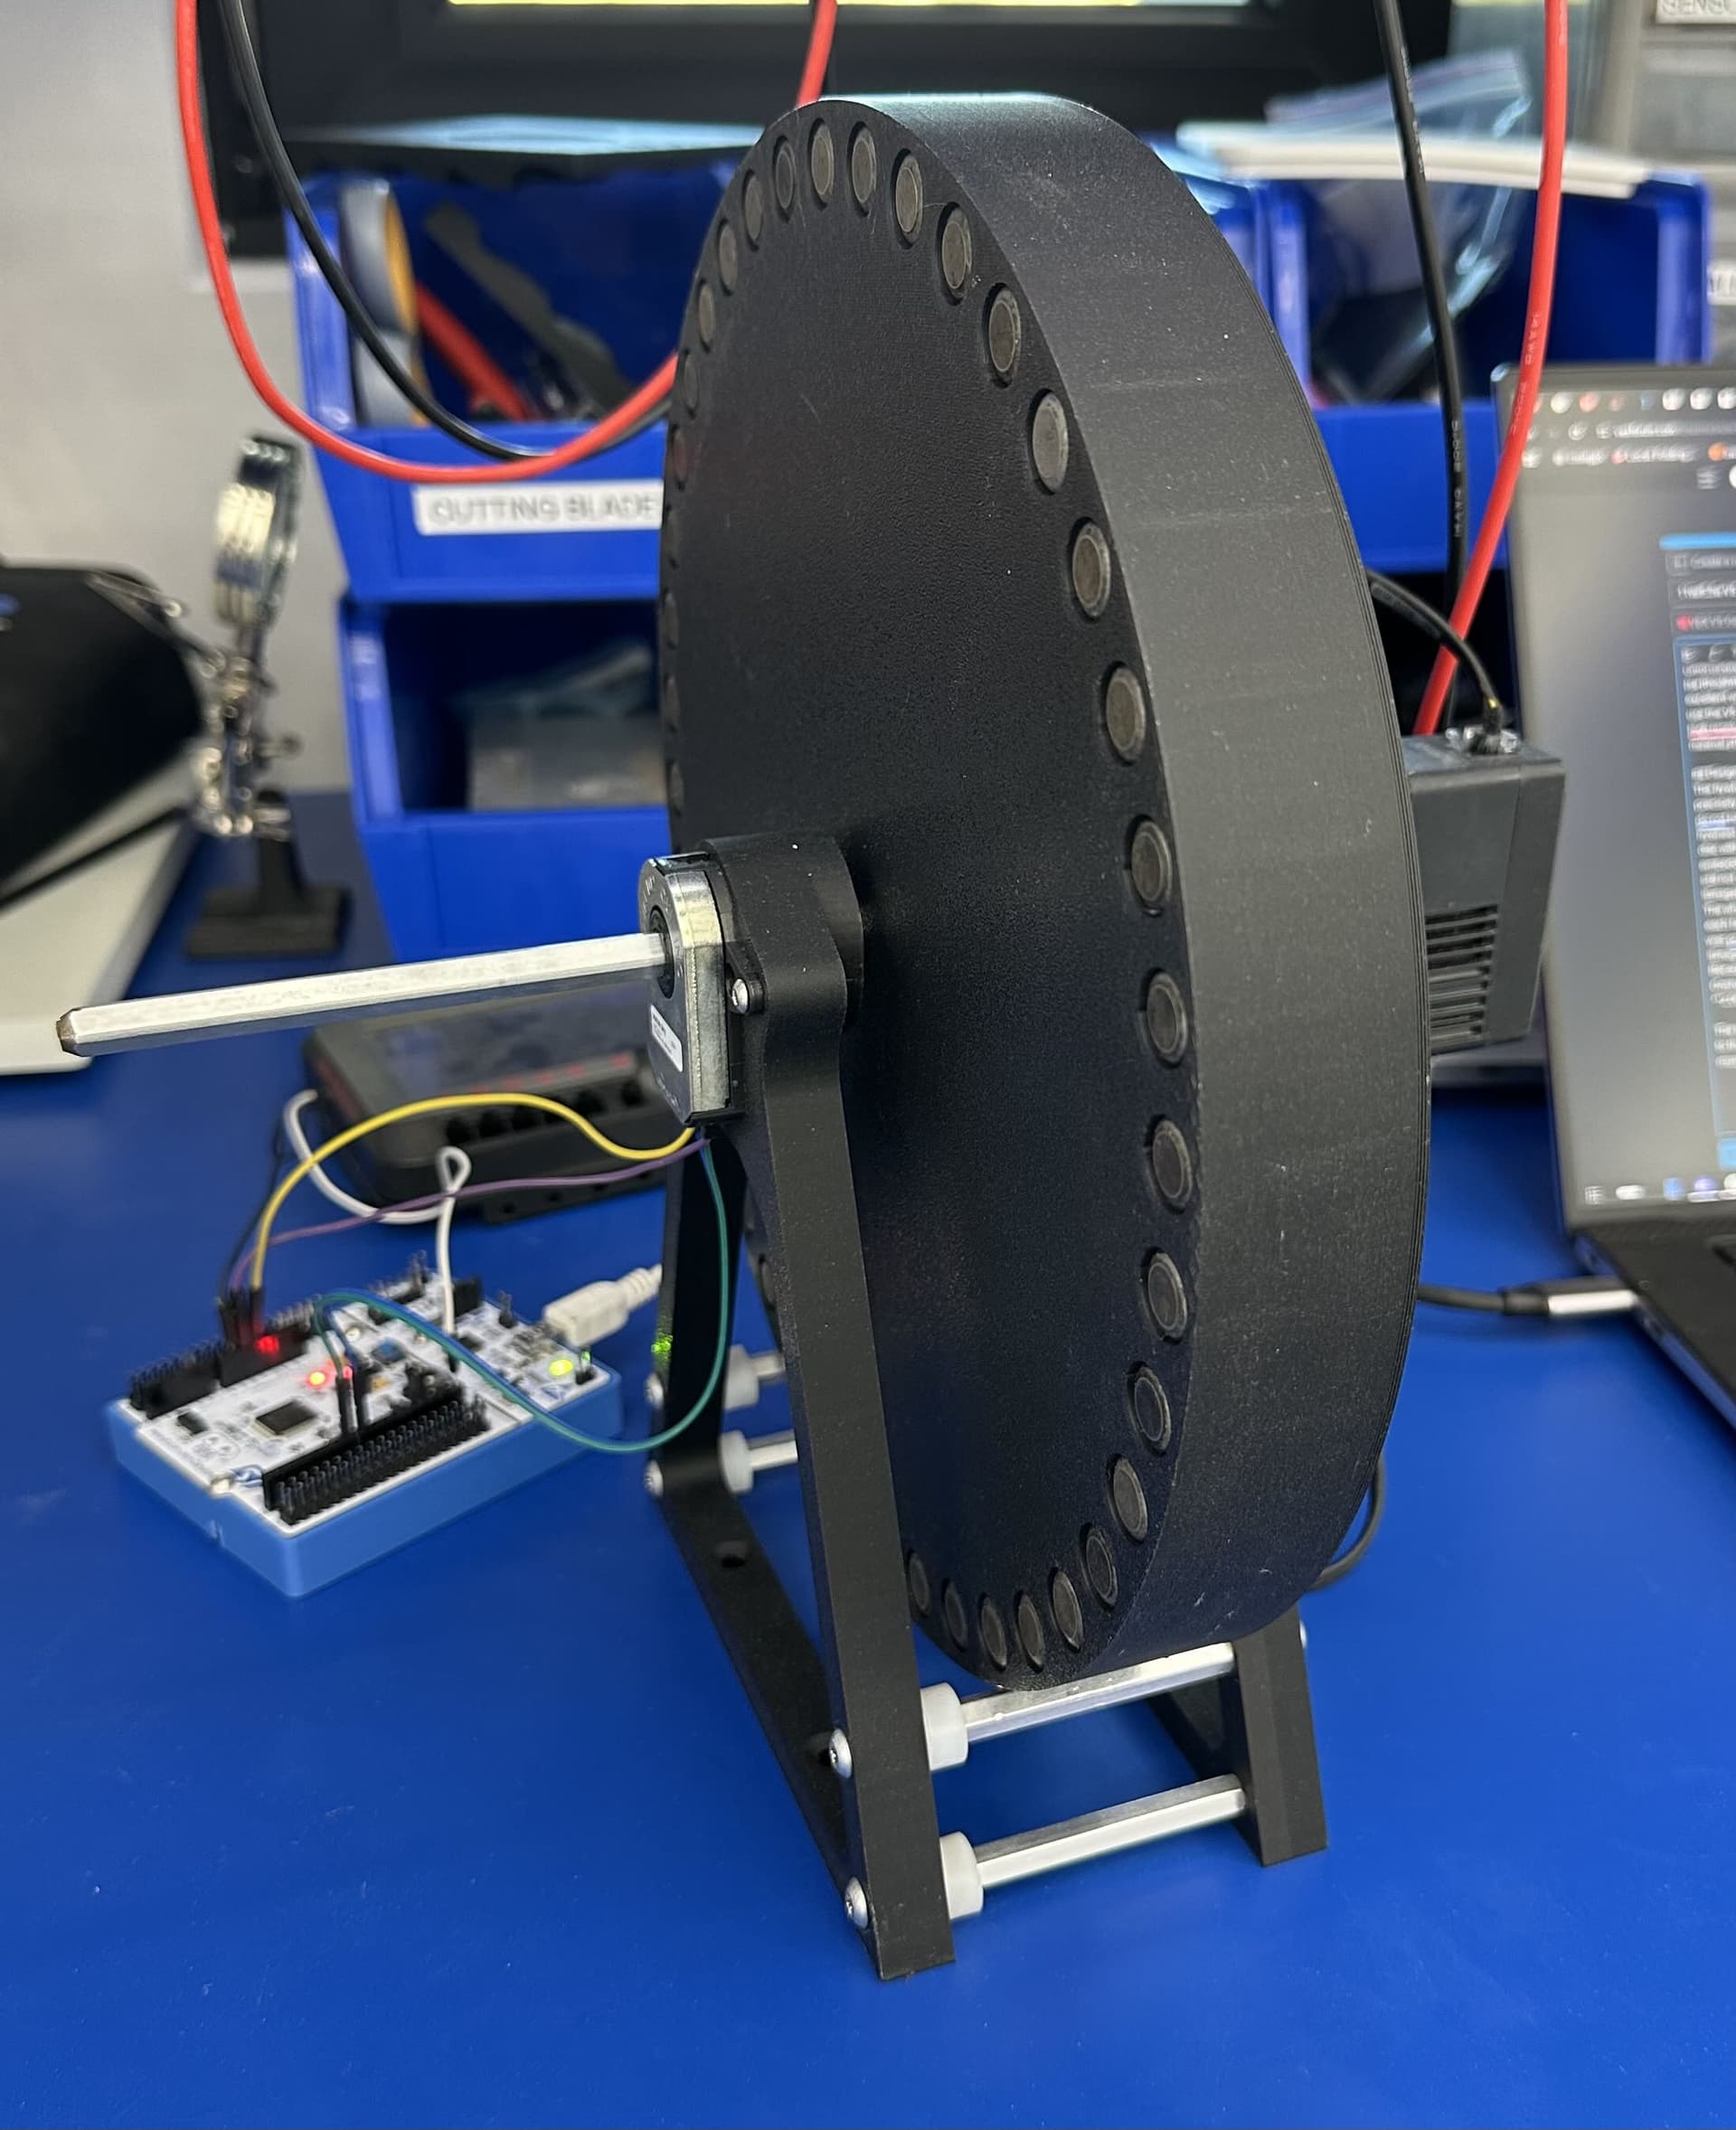
The flywheel itself is the most important aspect of the setup, as the Moment of Inertia must be precisely known in order to produce an accurate result. Due to limited machining capabilities (I do not have access to a lathe since graduating), I was not able to construct a solid metal flywheel because I lack a lathe which would enable me to produce such a perfectly balanced disc with a perfectly centered hole for an axle. Instead, I opted for a 3D printed flywheel with embedded steel weights in the perimeter which would enable a high moment of inertia while still not costing a fortune in materials. Here is the final design:
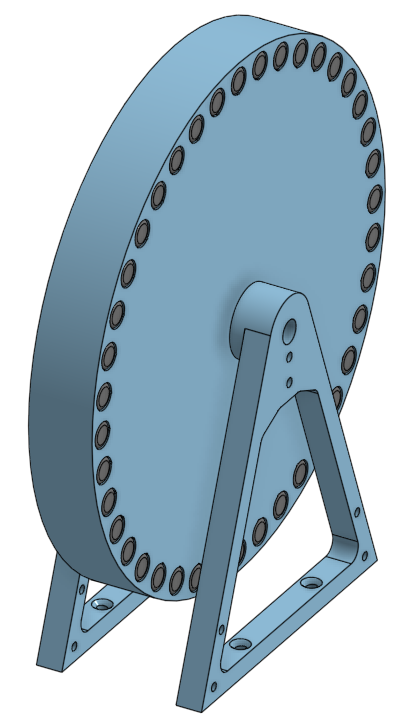
The wheel is 10.0" in diameter and is not fully solid, but has pockets to save on filament. Still, each face is flat so as to eliminate air resistance caused by exposed spokes. Each steel weight was press fit into place to prevent movement or the wheel becoming unbalanced.
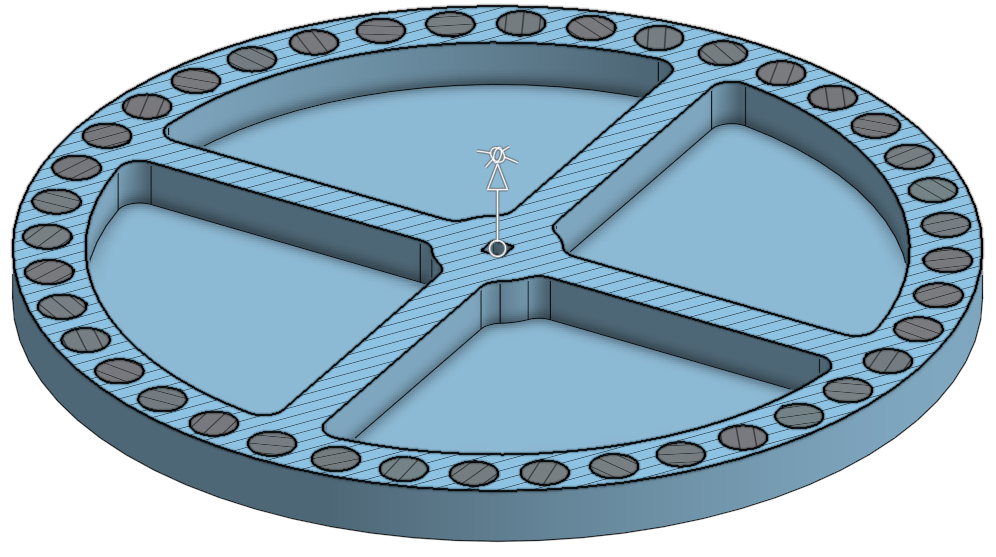
Because this was designed in CAD (and masses of all objects were verified), I was able to use Onshape’s measurement tools to get the wheel’s mass and moment of inertia, which are 2.003 kg and 0.0241857894 kg⋅m2
The legs each have a pocket for a VEX high strength ball bearing to be press fit into, and attach to the other using multiple standoffs which ensures the bearings are precisely lined up. Friction must be kept to a minimum to get the best measurements.
For velocity measurements, I opted for an external encoder instead of the one built into the V5 motor for accuracy reasons (see Theory above). I also chose to use an external microcontroller to record position data at precise timing intervals. The encoder I am using is the AMT102-V quadrature encoder with 8192 ticks per revolution. The external processor is an STM32 dev board I have.
Here is the final setup (with a 5.5w motor attached):
Results
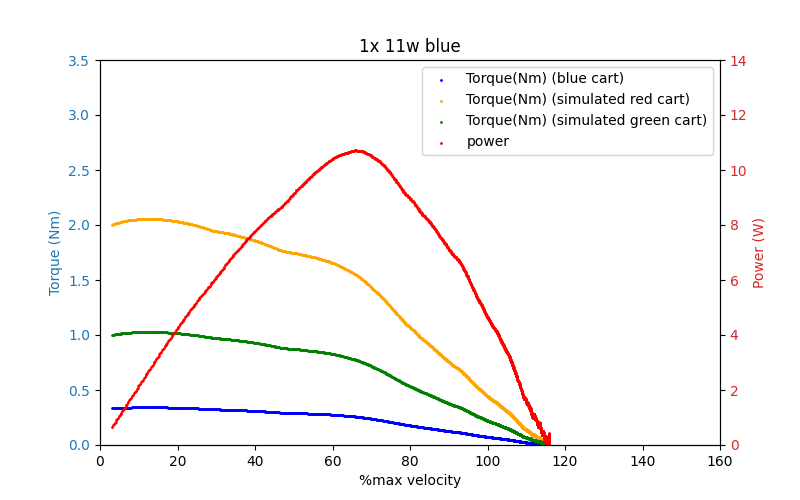
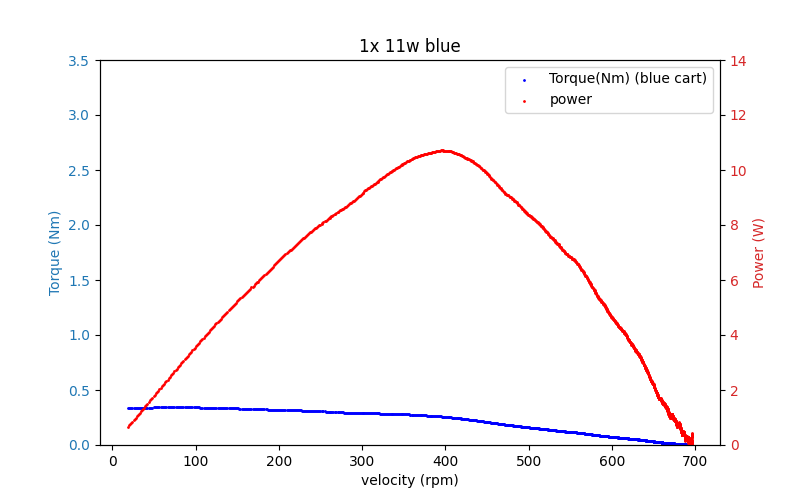
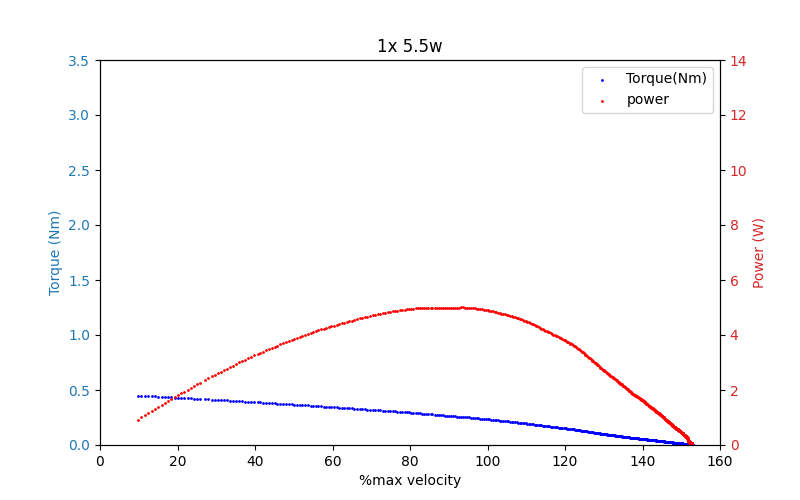
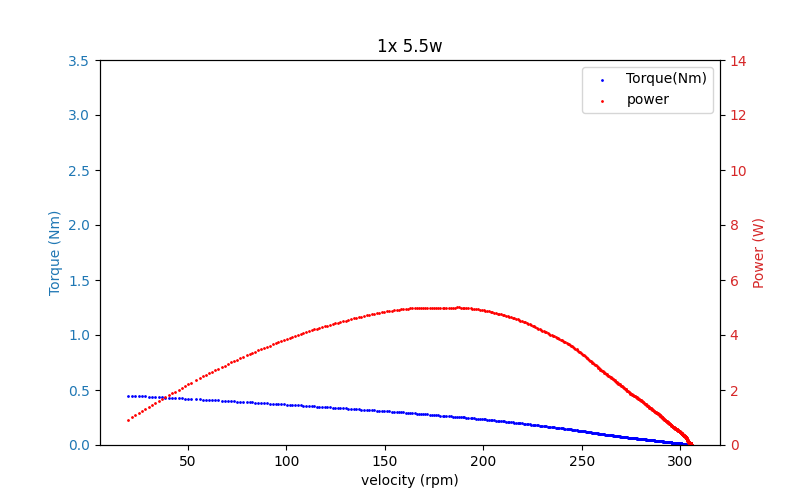
For now, testing one of each motor type that I have on hand, I was able to generate these two sets of graphs:
11W Motor
By % of rated velocity
Absolute velocity
5.5W Motor
By % of rated velocity
Absolute velocity
Discussion
The 11w motor’s performance largely lines up with what we expected! We see a peak output power around 65% of rated velocity, though it is marginally lower than we might expect (11W vs 12W). We also see that the flat current limit may not actually yield a quite flat torque output. The effect of the current limit is clearly visible, but the torque does still seem to peak near stall and gradually decline while under constant current, before finally declining in the right half of the graph.
The 5.5W motor’s performance differs quite a bit from the graph from VEX, though of the two motors this was more expected given the synthetic appearance of the 5.5W motor graph from VEX. First off, free spin velocity is around 150% of the rated maximum velocity. This means that if speed is what you’re after, utilizing pwm control for 5.5W motor can get you quite a speed boost (but not a power boost, of course). The peak power also appears to occur a lot later than predicted by VEX, at around 190 RPM vs the predicted 125 RPM.
Future work
Now that I have this test rig, there’s lots of additional questions I’d like to explore, such as:
- How does changing the current limit affect performance?
- How much variation in performance is there between units?
- I’d like to do a deep dive into how much current the motors draw from the battery in different scenarios with independent measurements. I’ve already looked into this a bit (actually this was the reason this post wasn’t made ~8 months ago), but the numbers don’t quite seem to be adding up, likely because of the PWM+inductance of the system causing power factor issues. I’m not formally educated in EE, so if anyone has any suggestions I’m happy to hear them
 .
. - I’m also planning on open sourcing the code for everything here including the python for calculating the graphs from the position/velocity data, the software on the STM32 and the brain, and the model files for the wheel/stand. I just need some time to polish things up. Hopefully I’ll have some time after worlds.
Thanks for reading, I hope you learned something from this thread! If you have any suggestions for improvements or for things to test, feel free to mention them below.