Hello! I was thinking about how best to launch rings into the Spin Up high goals and I created a tool that others may find helpful.
When designing a disc launching system, I was evaluating how it needs to be able to shoot discs. I wanted to launch the discs such that they score in the high goal at as large of a range of distances as possible. Ideally, the robot would be able to land discs in the goal from both close distances and from far distances. The initial velocity of the disc, the angle at which it is launched both must be optimized based on the launch height to maximize this value.
This problem led me to making a Desmos graphing tool that models the disc’s height as a function of position.
The Math (Summary)
This was made using simple kinematic motion modelling. Drag force was not considered because this is not meant to be a totally exact representation of reality. If someone wanted to add this functionality they would be welcome to.Kinematics is a simple physics concept that models the path of objects (particles) moving with forces on them. It uses simple algebraic equations (derived from the calculus) to simplify the math.
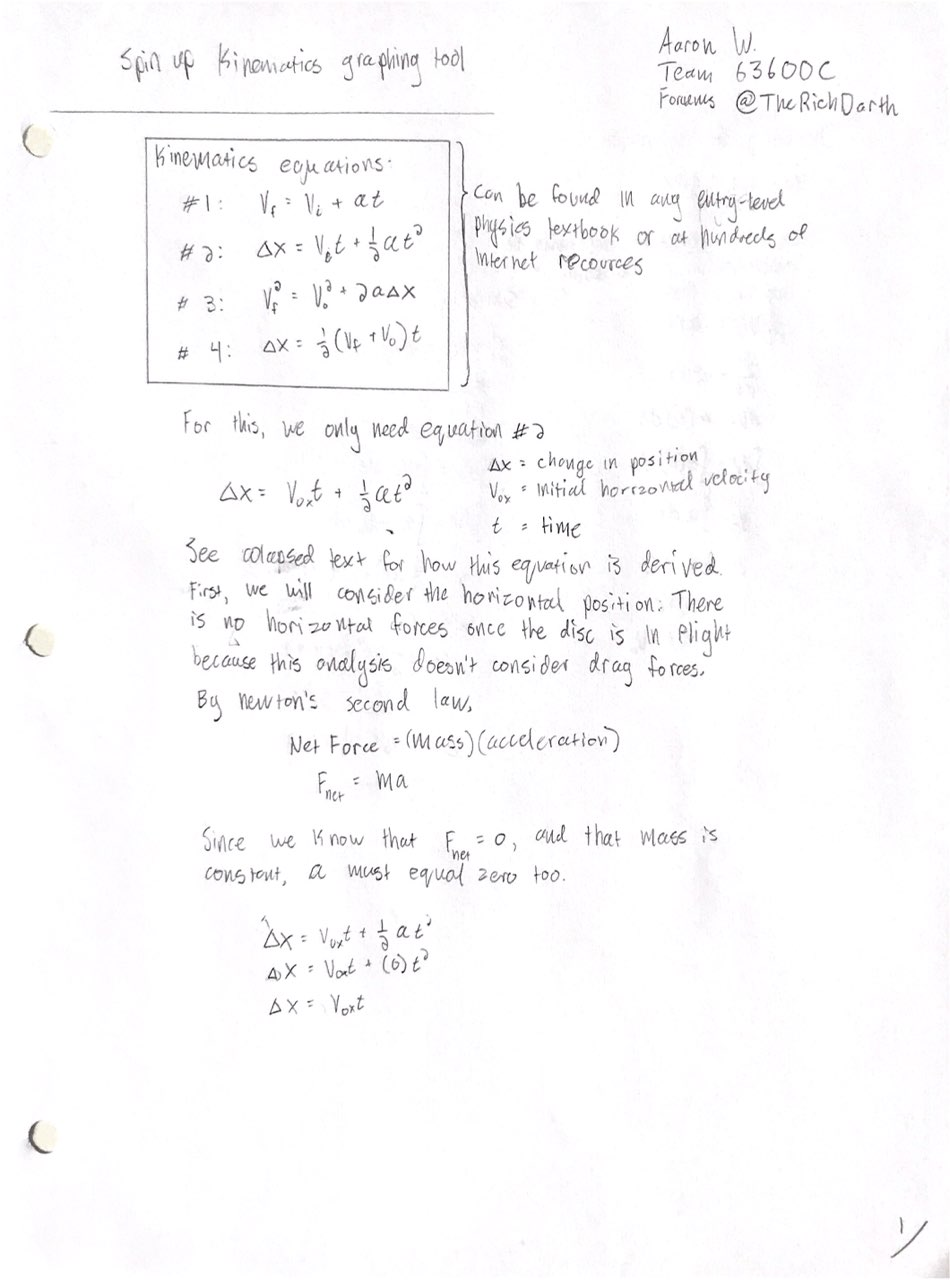
This specifically uses the following equation:
![]()
I solved the equation for horizontal position for time to find time as a function of horizontal position then used that time value in the vertical position function to attain a function that relates vertical position to horizontal position. If you want a more in depth explanation, DM me and I can send you resources or show my work.
Description
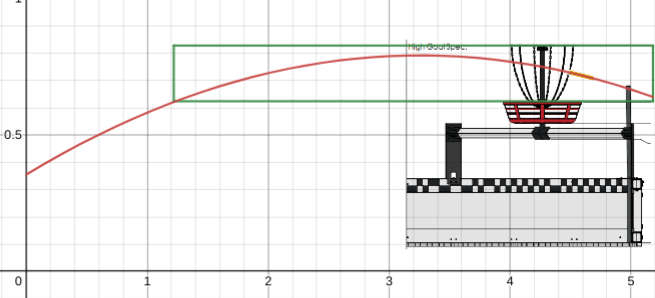
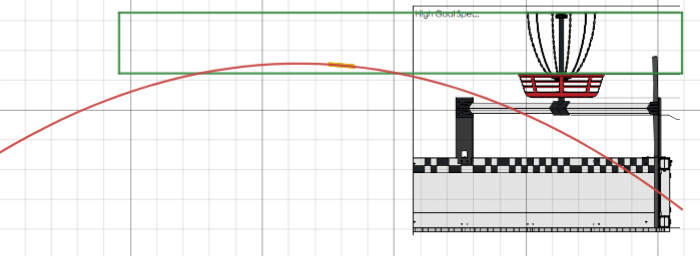
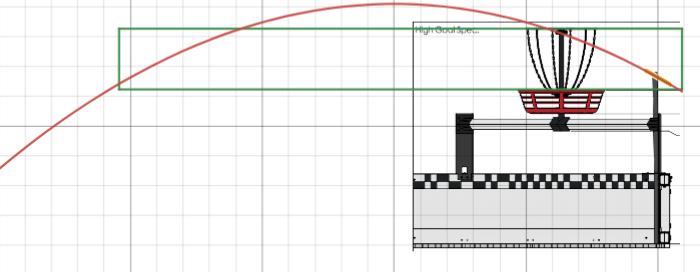
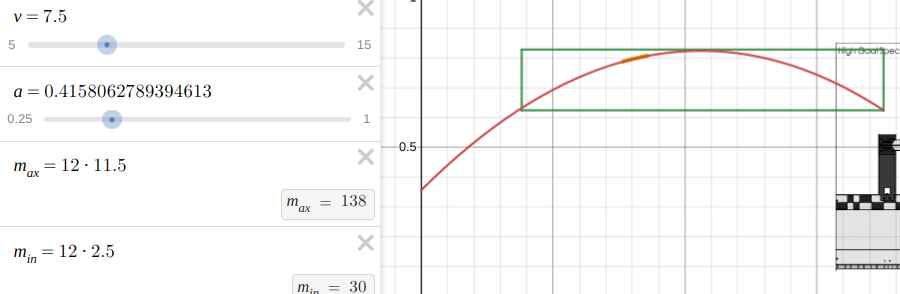
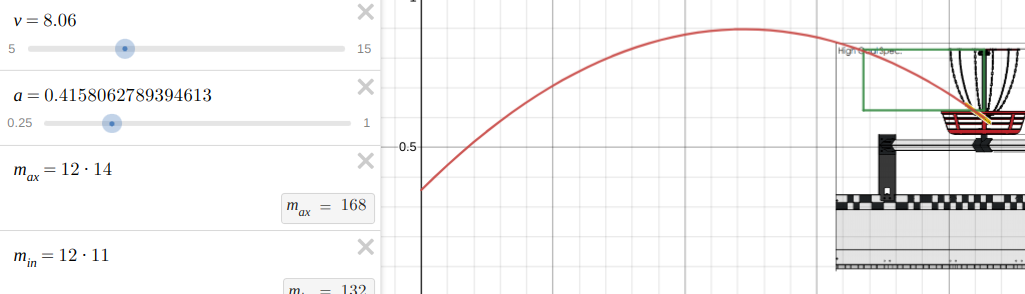
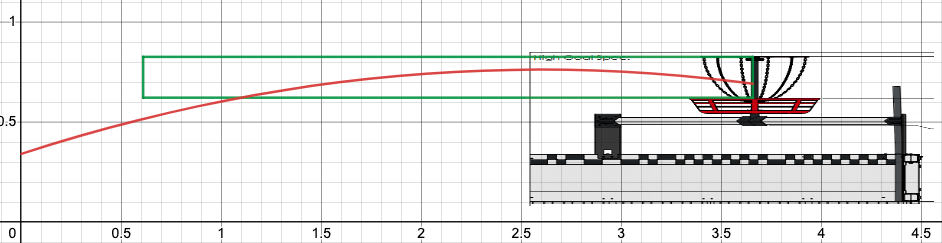
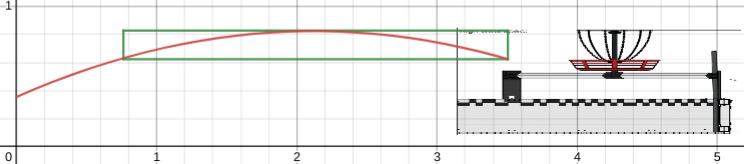
This is a simple graph to view the kinematic model for a disc shot towards a high goal. The green box represents the zone at which the disc will hit the high goal. This graph has position on both axis. The Y axis is the vertical position and the X axis is the horizontal position. The upper and lower horizontal lines of the green box are placed at the highest and lowest height a disc can reach the high goal respectively. To match the specified tolerances, I placed these values at 26 inches and 24.5 inches. Drag forces are not considered. I also added some images to better show what is going on.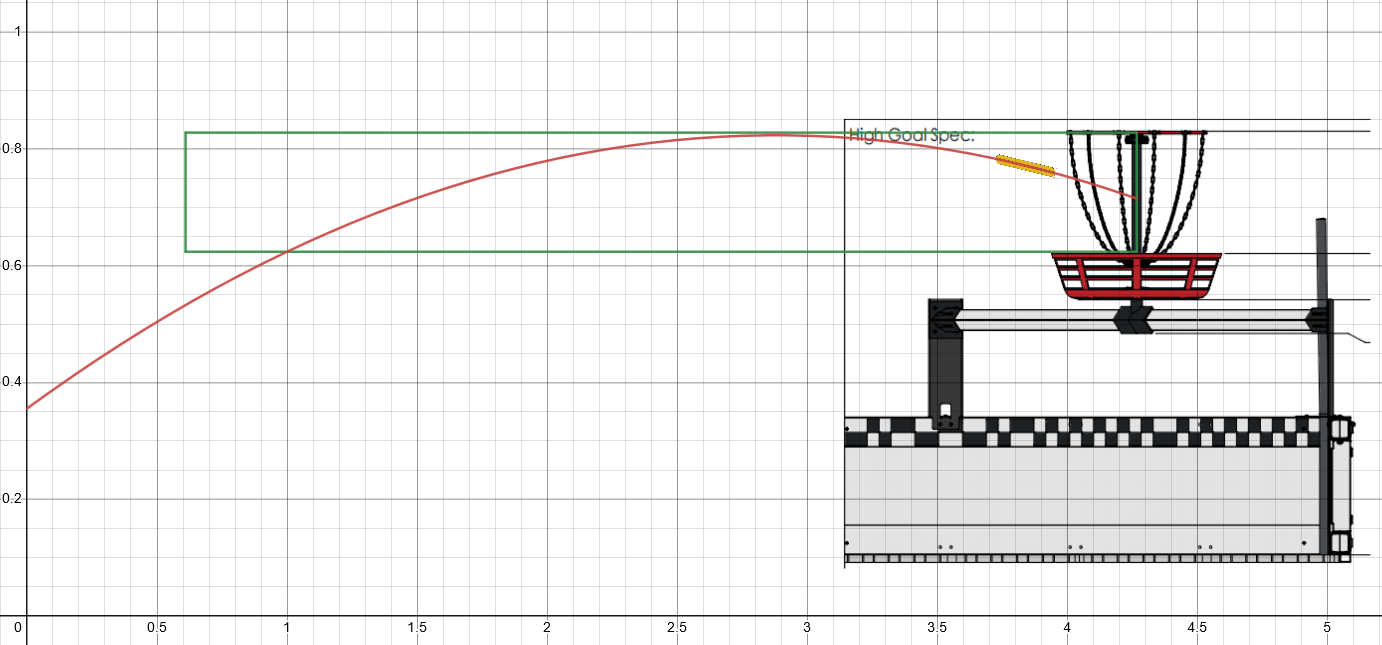
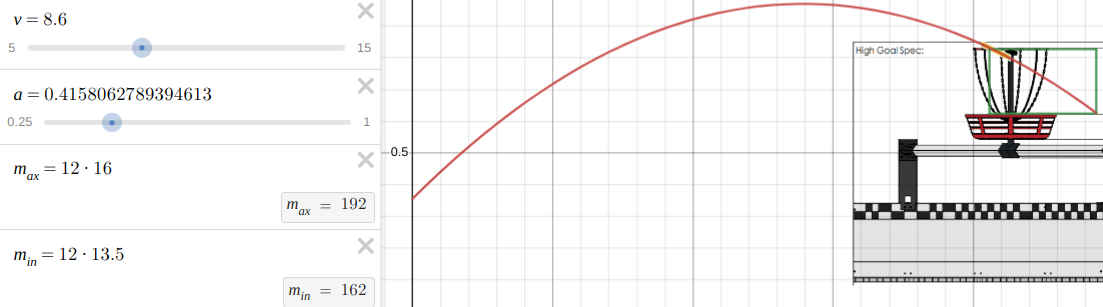
This desmos graph shows the disc’s height as it travels away from the robot. The X axis is position away from the robot (Meters) and the Y axis is the disc’s height (Meters) with a given launch height, angle and velocity. The green box represents the zone in which a disc will land in the high goal. The upper and lower bounds of the green box are placed at the height of the highest and lowest height that a ring will land in the goal. All values are configurable and the effects of a change can be easily seen. You can adjust the left and right bounds with the “Min” and “Max” variables to fit the desired range of distances that the robot can shoot from.
The purpose of this tool, as stated above is to find values of initial velocity, launch angle and launch height that will make the disc fly as desired.
First the left and right limits are selected. (I set them at 2 feet away from the robot and 12 feet away to be able to shoot discs from almost anywhere on the field) Then, you can adjust the variables “h” for the height of the launched disc, “v” for the initial velocity of the disc and “a” for the angle if the disc. Note the units for each variable. They are described in the Desmos comment.
Fun features
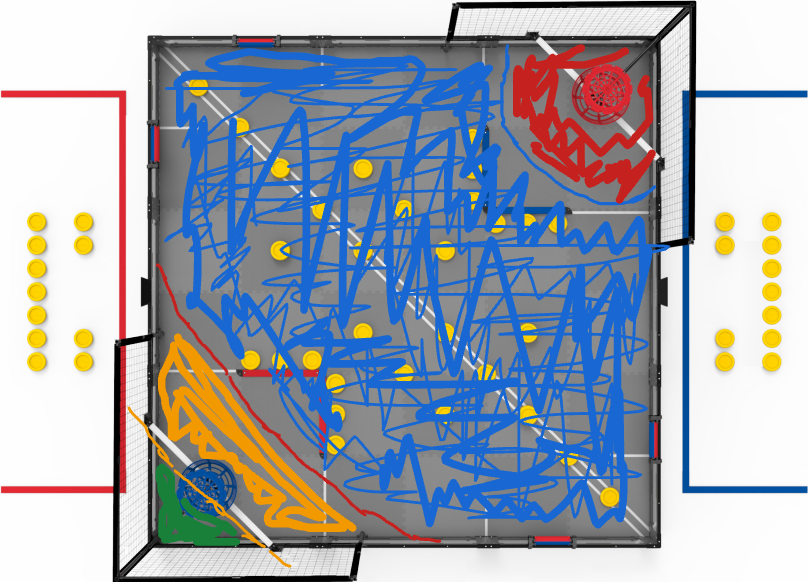
As you can see, I added a few images representing the game objects. I also set up the disc such that it will be placed on the graph with the correct position and angle. If you click the play button on the variable "discx" the disc will be animated moving through it's trajectory.Please let me know if you have any questions or if this was helpful for you. I made this in an afternoon mostly for fun and to make the math easier to visualize.
Edit: I amended this post to include the complete math that led to the equations used in the graph as @Sidoti requested. See the below collapsed text below. Also, @DrewWHOOP I am aware of the inaccuracies in this method and the factors it doesn’t account for. I would love to do a more comprehensive analysis of the physics involved. Some other people shared some resources that may assist in that. (I may do so with my physics teacher since my AP exams are over)
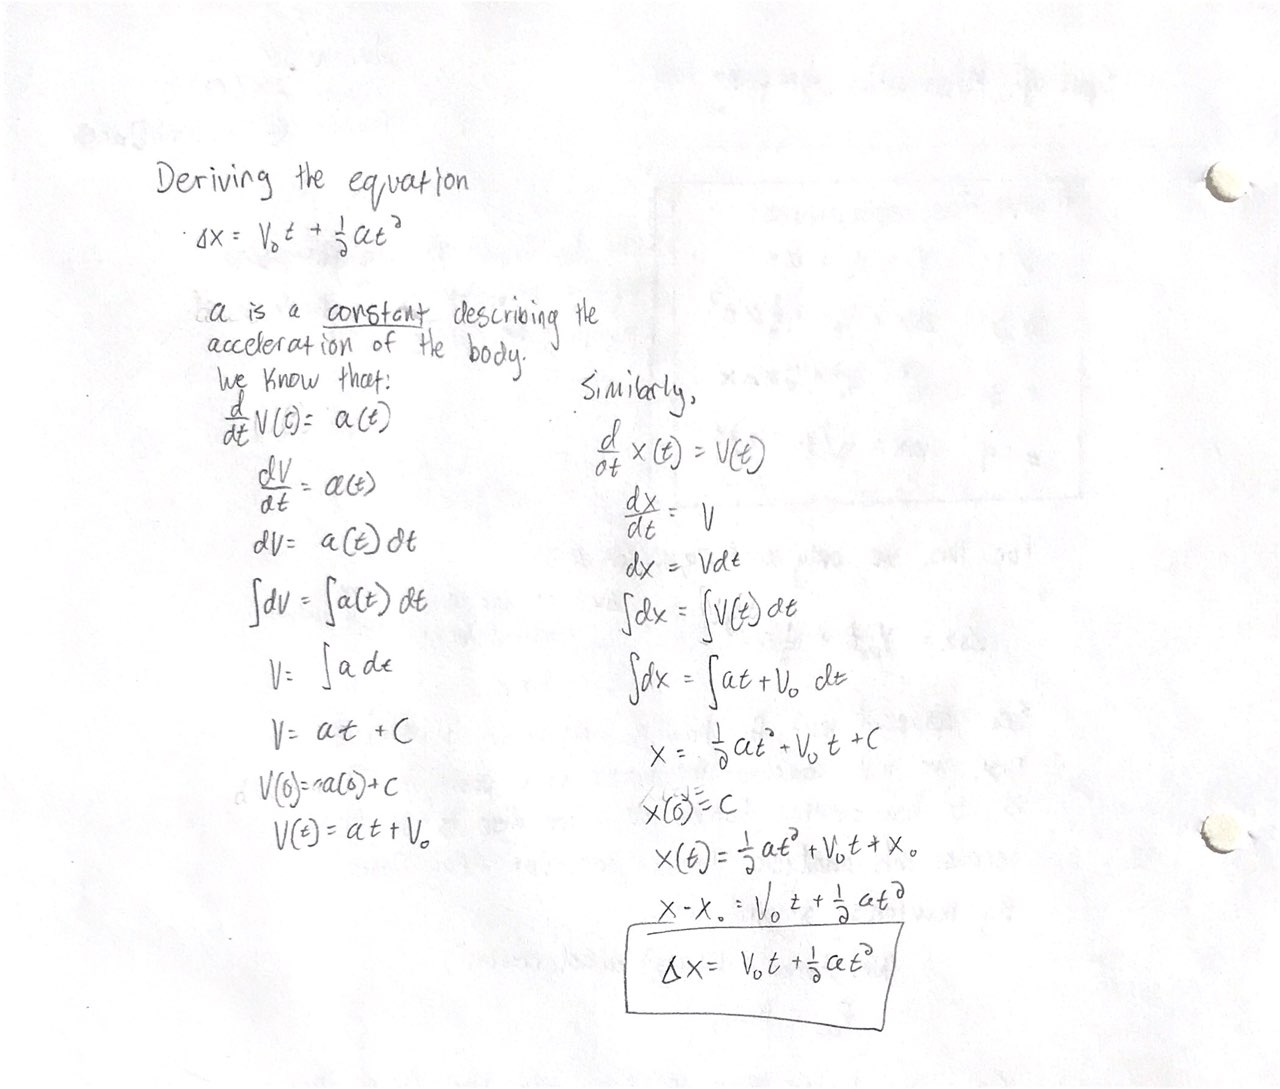
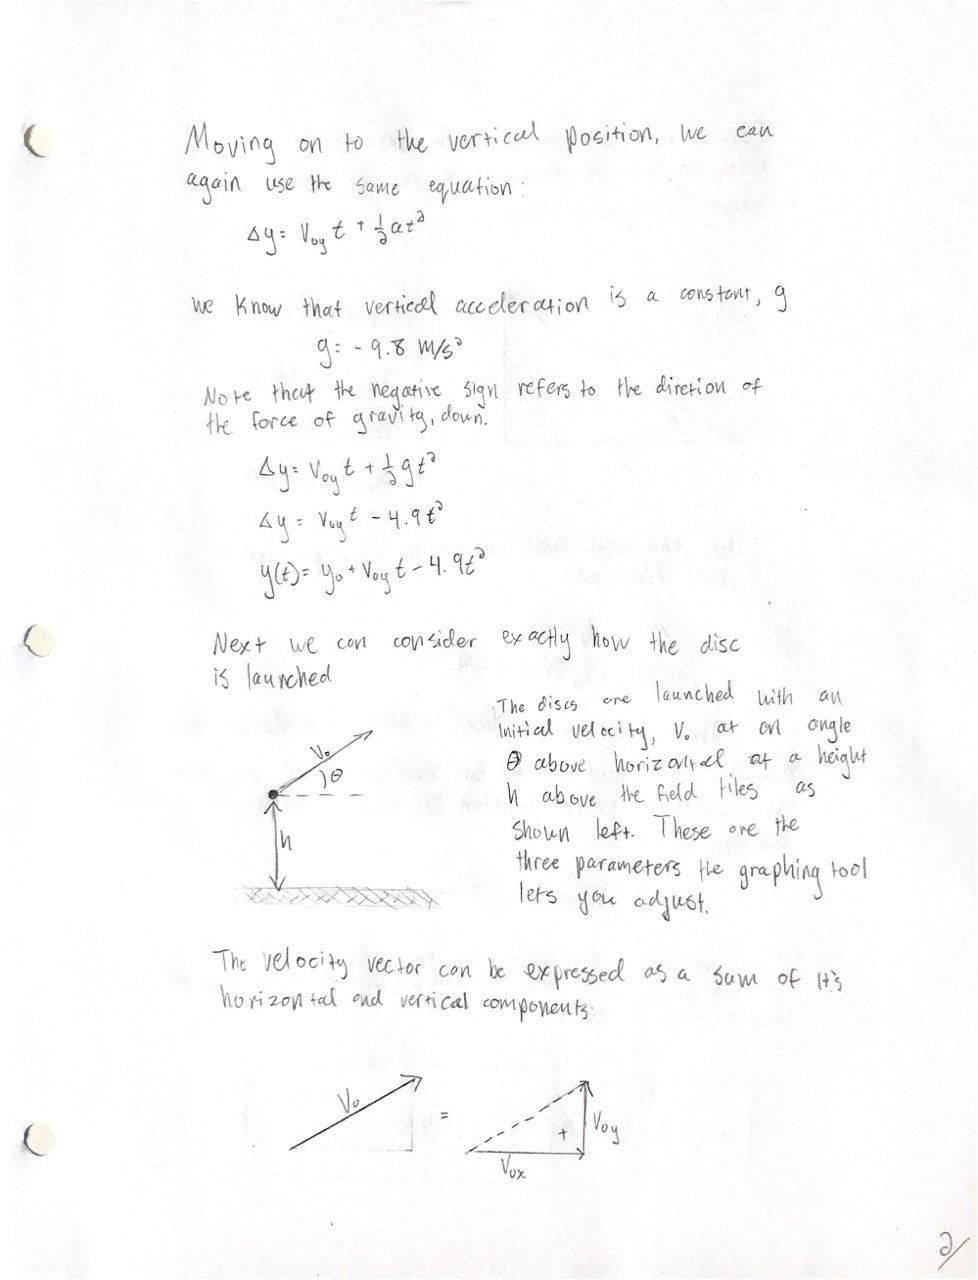
Complete Math
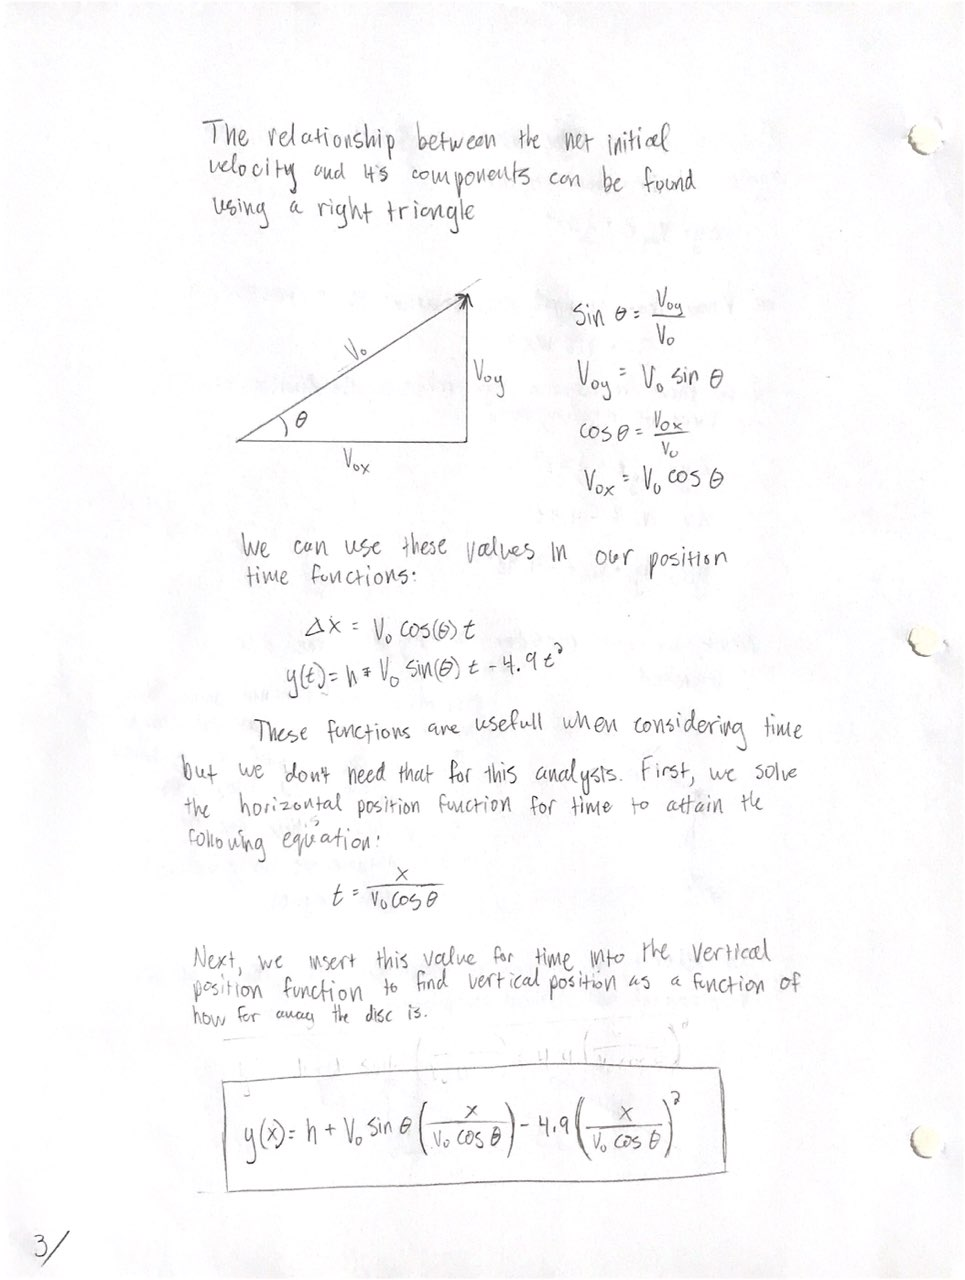
Here is the math I used to find the equation in the graph. I tried to include as much detail as possible but I may have omitted some details still. As I said above, if you have any questions about it, feel free to DM me or reply below. I did the work on paper because I don't know tools to correctly format the equations digitally.The kinematics equations used below (I included all of them on the top of page 1) are derived from calculus concepts. (The additional hidden page shows how the equation we used is derived) Except for that, all the math I used was algebra and simple trigonometry and Newton’s Second law.
Page 1/3:
Page 2/3:
Page 3/3: